

© 2018 IPE
© 2018 IPE
IPE has been working for more than a year now to develop a fully operational model under OASIS LMF. The model we designed is for HAIL peril in France and we are already expanding it to Europe.

The following post is designed to cover technical matters around implementation of a model under OASIS LMF.
A CAT model is usually summarized using 4 main blocks :
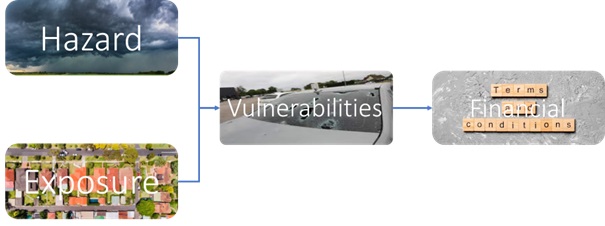
The reason we choose OASIS LMF is because they normalize/implement the following modules :
Hence developing a model under OASIS LMF allows you to “focus” to core modules of a CAT model which are Hazard and Vulnerabilities.
The main structure of a CAT model under OASIS LMF are as follow :
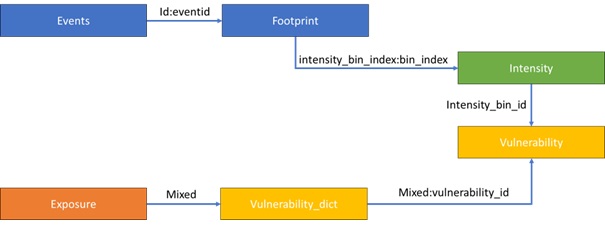
The blocks are synthetized as follow :
Easy shall we say ! But let’s dive deeper starting with the geocoding troubles !
Like any other CAT model exposure is flawly qualified in terms of geocoding meaning any kind of localization is acceptable whether with lat/lon, zip code, administrative levels or country level.
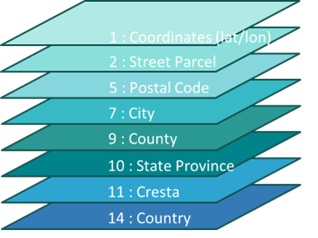
The Footprint you have is basically designed at one or more but not all levels… That’s when the geocoding level kicks in as portfolios comes with mixed resolutions and you have to support them all. OASIS does not embedded any geocoding system so you have to encode it all.
Our model was encoded at the most granular level meaning lat/lon and refined areas called INSEE codes but exposure coming at city level or admin levels (Region, Departement, Canton, Commune for France) could not be matched to our model footprint resolution.
We therefore integrated aggregation processes of the hazard to Commune, City, Departement, Region which required assumptions using external information like Surface, Population density, Number of Houses. The results were obviously not acceptable because the aggregated exposure where not decomposed by OASIS as they thought they were. In the end, aggregated exposure were all correlated leading to meaner losses in low return period and higher results in high return period. The aggregation process worked only for detailed single risk.
We hence had to implement a huge pre analysis script which is ran before model run to decompose aggregated exposure. That was clearly not an easy peasy journey as each exposure coded at a country region at to be drill down to probabilistic localization of region, then department, then canton, then city, then code commune to handle any kind of encoding.
Purely technical you shall say, just a mapping problem using assumptions to decompose exposure… Just factor in the decomposition exponential where a location at country level would be decomposed into 36000 probable locations. Exposures data poorly miscoded lead to billions of probable locations and OASIS was not running to the end running out of memory.
To tweek it, we had to use heavy servers to ran each and every aggregated exposure for each given level to detailed one and run optimization to choose the best locations limited to an 100 with at least one subregion represented to best minimize the output error. This georesolution problem and optimization took us almost 3 months to figure out a solution and implement.
The vulnerability is pretty easy, for an exposure and an intensity class, you have a distribution of Ground Up Losses. But wait a residential flat does not have the same vulnerability as a residential home. Ok there are basically 195 OED Occupancy codes so has many vulnerability curves.
Wait a residential home with Roofcover being Thatch, clay, zinc, felt, wood, aluminium don’t react the same. They are 28 different Roofcover that’s 195*28 = 5420 different vulnerability curves.
Lest inject the construction type that’s just 195*28*210 = 1,146,600 vulnerability curves.
In our model we had to inject geographical specificities which just exploded the number of vulnerability curves to hundred of millions vulnerability curves. To solve the problem, we had to highly simplify the problem and override the OASIS LMF process at all level :
Hence we highly reduced the number of vulnerability curves to few hundreds.
The main difficulty we are now facing is the actual adaptation to CROPS which highly differ from property as in in property business insured value is assumed stable over a year while in CROPS, the loss is highly dependent on the time. Considering Winter crops, a hail in June will be highly devastating while a hail in august will have no effect on them (harvest being done) but would destroy spring crops…
Vulnerability becomes a time dependent problem. Not having solved all of it, our prototype was to duplicate each exposure 12 times with a month allocation, create a monthly vulnerability curve based on crop type and assigned and post process detailed results to select the loss of the given month using the occurrence preselection to have it all.
The solution is not ideal at all as it multiplies by 12 the number of exposure to be treated and ran, plus we have to run a post process to select the adequate loss given the month of occurrence. This because OASIS allows a mapping to vulnerability curves for an exposure but not for an exposure cross event or time dependency.
Demand surge is basically an other inflation for major events… After a major event there is a shortage of construction materials for example hails leads to a shortage of tiles. The price of tiles then inflate far beyond normal because of market shortage. The impact if pretty unlinear as there are some inflexation points with binary effects. That can not be integrated into OASIS Models. To do so we also had to post process losses. But given the high load of portfolios we couldn’t keep track of each and every loss with split by occupancy so we had to simplified the vector using return periods thresholds to apply loading factors. The modeling not being ideal we did not delivered it in production yet.
Currently OASIS ran either on a server or a docker image. The processing is multiprocessed and we had some back and forth with OASIS to improve some computation blocks. There is still a hit wall, where you won’t be able to run big portfolios depending on your configuration as OASIS is python script and charge both account and location of the OED, should your server not be able to load it all then you end up with a crash and OASIS cannot chunk them. Currently we ran a 32 Gb session with 8 processors, we identified the breaking point at 8gb location file size. Above OASIS will crash not being to load exposure.
In order to increase this OASIS limit we designed a script in R (which consume less memory than python) to load account and location files. We then chunk the accounts and locations into sub OED, ran the OASIS in sequence and reaggregate the results to recompute the EP curves.
The chunking is not ideal as we only have the average mean of events and not sampled losses of events and it takes a long time to chunck run an postprocess but it allows at least to run some big portfolios. We can’t go through huge portfolios at this stage.
We still thing OASIS has been the good solutions event there are some missing blocks. We wish OASIS will next develop:
Developing a model has been quite a journey, it took us more than an year, roughly 6 months to develop the model per say and 6 months to implement into OASIS LMF. Going forward an OASIS LMF implementation will be more straight forward knowing limitations and how to deal with.
Should I summarize it, the development and implementation has been a very hard journey far beyond we originally anticipated and sometimes I really doubt we would be able to make it. That when OASIS LMF support gave us a hell of help and support to deliver.
I would like to give a special than to :
With all all that being said, we keep moving trying to expand our model to broader coverage, we’ll also try to help organize an OASIS Event next year in Paris, stay tune !
Should you be interested or have any question around implementation, please ask me I’m here to help.